During Cultivating wellbeing program provided to staff in 2018-2019, participants were asked to fill in a questionnaire and answers were collected and analyzed. The questionnaire includes Satisfaction with life scale, plus questions on physical activity, qat chewing, smoking, and night sleep hours.
This year, we are repeating the same survey again. If you are a Yemen-based Staff member, Please Click here to take part in the new study.
Following are the results of the statistical analysis to the previous 2018 survey:
Authors
Ayedh Nasser , Ahlam Almatari, Jamila Mohammed
The SWL Scale
Satisfaction with life scale is A 5-item scale designed to measure global cognitive judgments of one’s life satisfaction (not a measure of either positive or negative affect).
Participants indicate how much they agree or disagree with each of the 5 items using a 7-point scale that ranges from 7 strongly agree to 1 strongly disagree.
The scale was developed by Ed Diener, Robert A. Emmons, Randy J. Larsen and Sharon Griffin and it is an open source.
Sampling
Proper sampling was a shortcoming of this study. Attendants of the activities from different agencies participated, therefore the sample is that of convenience.
Randomization is not optimized. Usually, people attend depending on finding some free time in their schedules.
Therefore, It is not safe to assume that this sample is an ideal representative of the staff population.
Sample Population
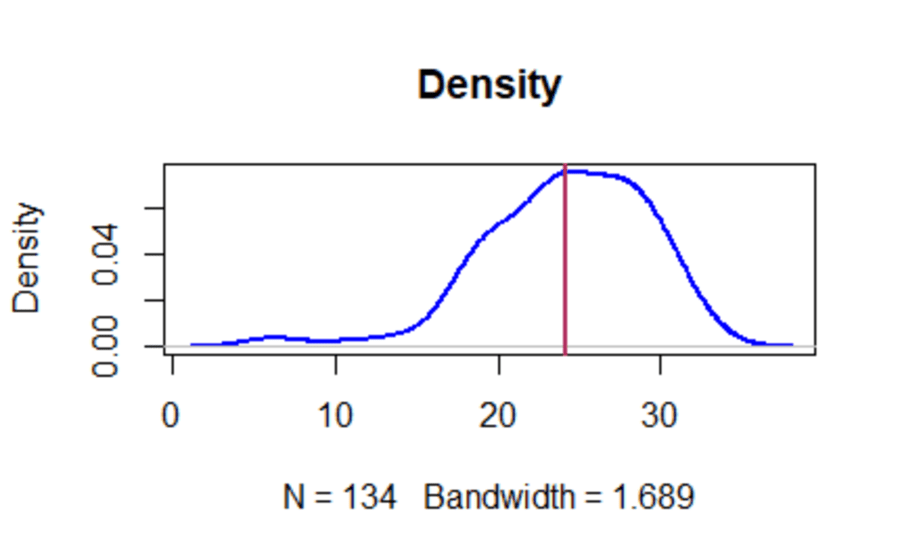
The total number of participants was 134 ;83 Males and 51 females; coming from 13 agencies.
Analysis
Analysis was done by R v4.2.2. Student’s T test and regression analysis were used to get inferential statistical results.
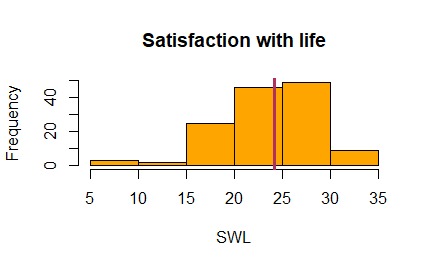
SWL
Satisfaction with life was found to be positive. The mean was 24.23. 75% of the sample scored above 21.
The scale cutoffs are as follows:
- 31 – 35 Extremely satisfied
- 26 – 30 Satisfied
- 21 – 25 Slightly satisfied
- 20 Neutral
- 15 – 19 Slightly dissatisfied
- 10 – 14 Dissatisfied
- 5 – 9 Extremely dissatisfied
Results Summary:
| Min. | 1st Qu. | Median | Mean | 3rd Qu. | Max. |
| 6.00 | 21.00 | 24.00 | 24.23 | 28.00 | 33.00 |
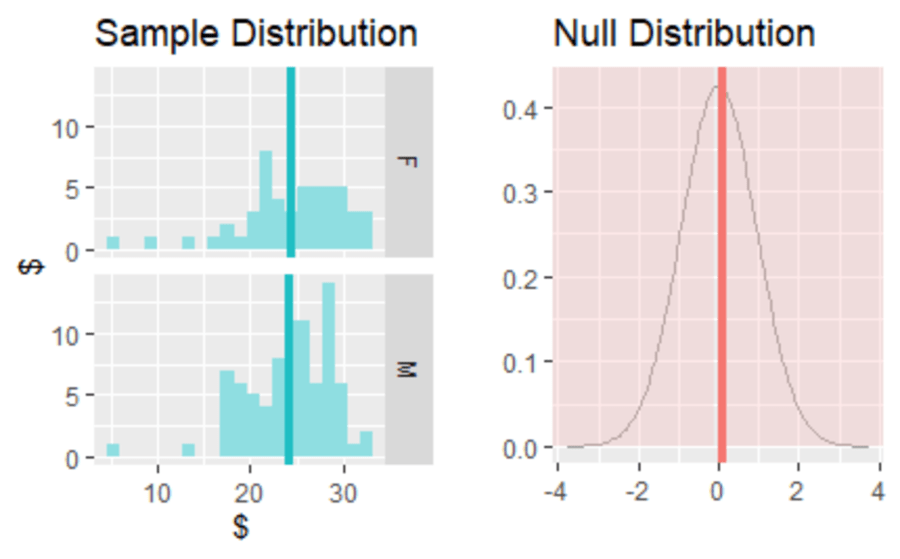
Gender effect
There was no statistically significant difference between males and females, (p-value = 0.91)
t = 0.10806, df = 89.708, p-value = 0.9142

alternative hypothesis: true difference in means between group F and group M is not equal to 0

95 percent confidence interval:

 -1.761929   ,  1.964622

sample estimates:

mean in group F   mean in group M

       24.29412        24.19277
Satisfaction with life was independent of agency, (p-value = 0.55)
Residual standard error: 5.02 on 121 degrees of freedom

Multiple R-squared:  0.08216,       Adjusted R-squared:  -0.008861

F-statistic: 0.9026 on 12 and 121 DF, p-value: 0.5465
Effect of physical activity
It was remarkable how the regular exercise affects the score. We found a 2-unit increase in the satisfaction of life when physical exercise is positive. (P-value : 0.01)
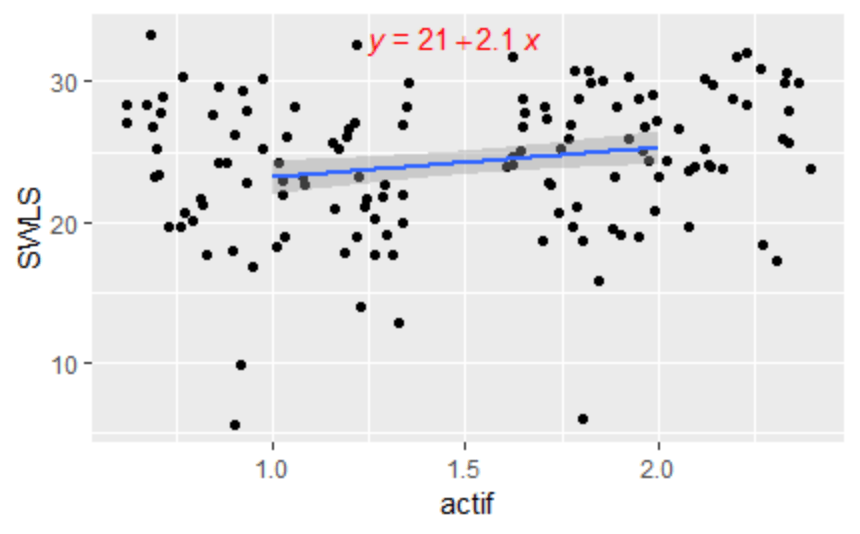
(Activity data was converted to numeric and scatter points jittered)
Regular exercise was defined to the participants as the equivalent of 150 minutes of moderate-intensity physical activity per week.
Residual standard error: 4.903 on 132 degrees of freedom

Multiple R-squared:  0.04466,       Adjusted R-squared:  0.03743

F-statistic: 6.171 on 1 and 132 DF,  p-value: 0.01424
However, Satisfaction with life was not significantly related chewing qat. p-value: 0.88
Residual standard error: 5.016 on 132 degrees of freedom

Multiple R-squared:  0.0001726,  Adjusted R-squared:  -0.007402

F-statistic: 0.02278 on 1 and 132 DF, p-value: 0.8803
Similarly, Satisfaction with life was not significantly related to regular smoking. p-value: 0.39
Residual standard error: 5.002 on 132 degrees of freedom

Multiple R-squared:  0.005661,     Adjusted R-squared:  -0.001871

F-statistic: 0.7516 on 1 and 132 DF, p-value: 0.3876
Also, we found no significant relationship between the number of hours slept during the night and satisfaction of life. p-value: 0.19
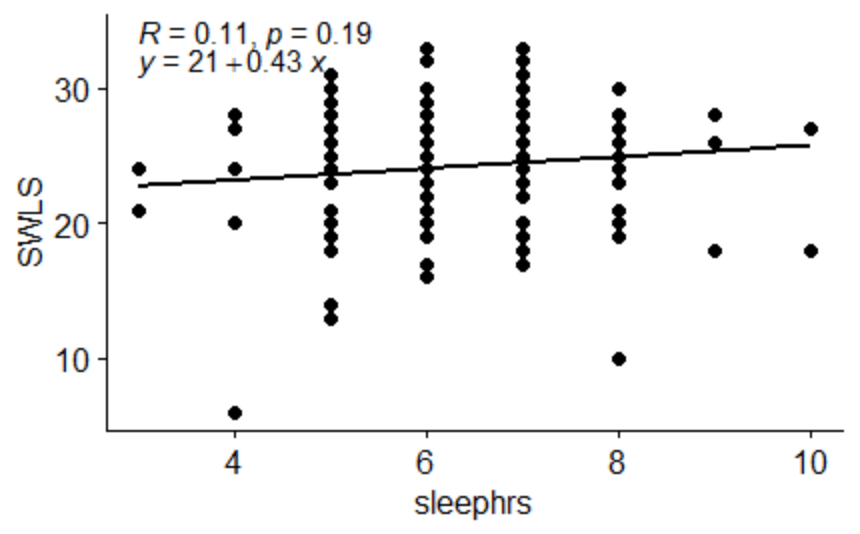
Residual standard error: 4.983 on 132 degrees of freedom

Multiple R-squared:  0.01321,   Adjusted R-squared:  0.005732

F-statistic: 1.767 on 1 and 132 DF, p-value: 0.1861
The average hours of night sleep among the sample were 6.4 hours. Only 25% of the responders sleep 7 hours or more.
| Min. | 1st Qu. | Median | Mean | 3rd Qu. | Max. |
| 3.00 | 5.25 | 6.00 | 6.41 | 7.00 | 10.00 |
Participate in this year study
to take part in 2023 survey, please click here
